您现在的位置: 萬盛學電腦網 >> 程式設計 > >> 網路程式設計 >> PHP 程式設計
PhpStorm 調試 PHP 完整教程:Xdebug 配置與除錯實戰
前言
本文為 PhpStorm 8.x + PHP 5.6 + Xdebug 2.2.5 環境下的詳細調試配置指南,新版操作邏輯一致,介面略有差異。
1. PHP 安裝 Xdebug
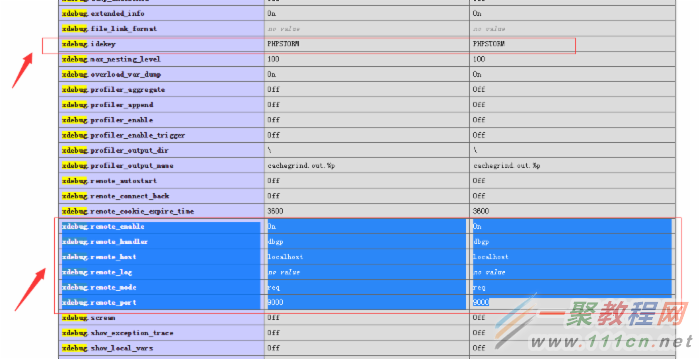
[xdebug]
zend_extension="D:\wamp\php-5.6.2-x64\ext\php_xdebug-2.2.5-5.6-vc11-x86_64.dll"
xdebug.remote_enable = On
xdebug.remote_handler = dbgp
xdebug.remote_host = localhost
xdebug.remote_port = 9000
xdebug.idekey = PHPSTORM驗證:phpinfo() 出現 Xdebug 區塊。
2. PhpStorm 配置
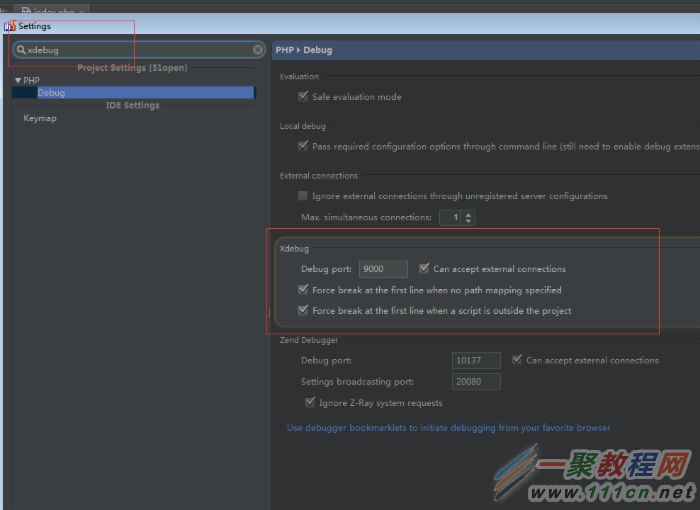
2.1 Xdebug Port 對齊
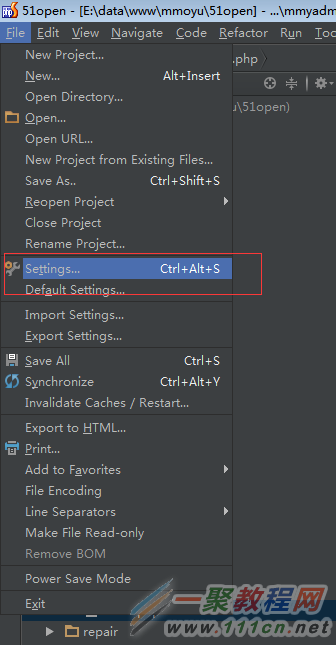
Settings → Languages & Frameworks → PHP → Debug,Port = 9000。
2.2 Debug Configuration
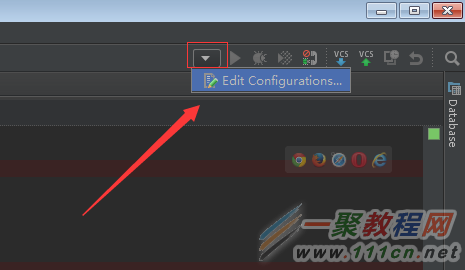
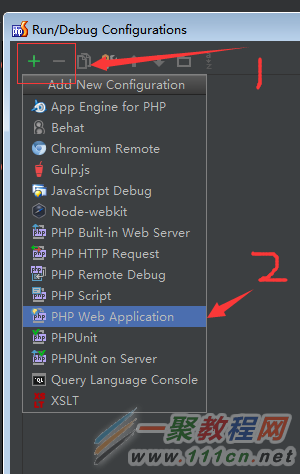
Run → Edit Configurations → + → PHP Web Application
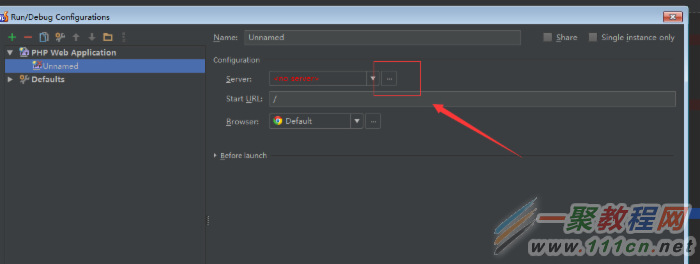
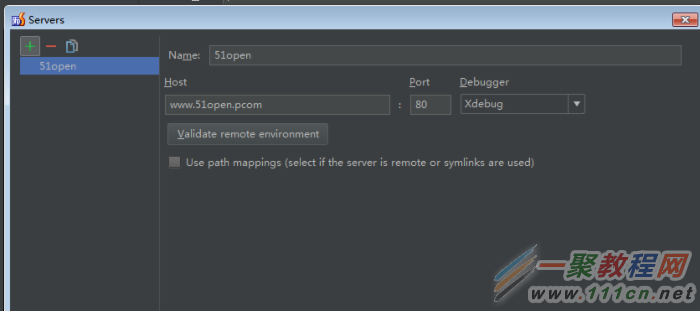
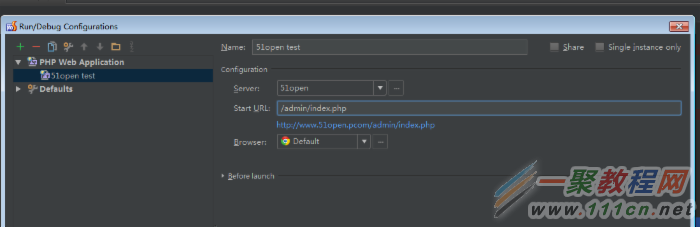
Name: 專案名,Server: 新增/選擇 localhost:80 Xdebug,Start URL: 你的本地站點。
2.3 Server 路徑映射
在 Server 設定中勾選 Use path mappings,將本地專案目錄對應到伺服器 DocumentRoot。
3. 開始調試
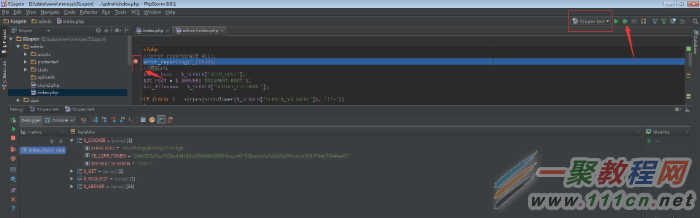
- 程式碼行號左側點擊設定斷點。
- 點擊工具列 甲蟲圖示 (Debug) 或
Shift+F9。 - 瀏覽器開啟頁面,PhpStorm 於斷點暫停,顯示 Frames、Variables、Watches。
調試操作技巧
- Step Over (F8):單步跳過函式呼叫
- Step Into (F7):進入函式內部
- Run to Cursor (Alt+F9):直接執行至游標行(極佳)
- Evaluate Expression (Alt+F8):即時運算任意表達式
- 條件斷點:右鍵斷點 → Condition 輸入表達式(如
$i > 100)
停止調試
再次點擊甲蟲圖示(變紅)或 Ctrl+F2,關閉 Debug 面板回到編輯視圖。
總結
掌握 PhpStorm + Xdebug 除錯流程,能大幅縮短定位 Bug 時間,是 PHP 開發者必備技能。
- 上一篇程序編程: PhpStorm + Xdebug 斷點除錯完整配置圖文教學
- 下一篇程序編程: ThinkPHP 模板引入 CSS/JS 完整方法:import、load、原生標籤
推薦文章
- PHP 圖片縮放實作:等比例縮放、多格式支援、品質控制
- PHP DOMDocument 生成 XML 完整教學:從基礎到屬性、命名空間
- PHP 替代語法:foreach 與 for 的冒號/endforeach/en…
- PHP 單一資料庫欄位多欄橫向顯示:分頁、分行、橫向輸出完整技巧
- PHP 多維陣列排序:依資料庫查詢結果指定欄位排序
- PHP 批量生成圖片縮略圖:支援 GIF/JPG/PNG、MD5 命名、遠端圖片…
- PHP表單數據獲取完全指南:$_GET/$_POST/$_REQUEST、過濾驗…
- Smarty 快取機制全攻略:全域、區塊、局部三種快取策略完整實作
- PHP 協程與生成器實作合作式多任務調度器
- PHP set_time_limit() 深度解析:運作機制、常見失效原因與正確…
copyright © 萬盛學電腦網 all rights reserved