萬盛學電腦網 >> 數據庫 >> mysql教程 >> 壓測之sysbench安裝和MySQL只讀測試
壓測之sysbench安裝和MySQL只讀測試
sysbench編譯安裝
[root@DS-VM-Node160 ~]# cd /tmp/
[root@DS-VM-Node160 /tmp]# git clone https://github.com/akopytov/sysbench.git
[root@DS-VM-Node160 /tmp]# cd sysbench/
[root@DS-VM-Node160 /tmp/sysbench]# yum install mysql mysql-devel libtool openssl-devel openssl-static mysql-community-devel -y
[root@DS-VM-Node160 /tmp/sysbench]# ./configure -V
sysbench configure 0.5
generated by GNU Autoconf 2.69
Copyright (C) 2012 Free Software Foundation, Inc.
This configure script is free software; the Free Software Foundation
gives unlimited permission to copy, distribute and modify it.
[root@DS-VM-Node160 /tmp/sysbench]#
[root@DS-VM-Node160 /tmp/sysbench]# libtoolize --force --copy
[root@DS-VM-Node160 /tmp/sysbench]# ./autogen.sh
[root@DS-VM-Node160 /tmp/sysbench]# ./configure --prefix=/usr/local/sysbench
###如果需要測試PostgreSQL、Oracle,則在configure時需要加上 --with-oracle 或者 --with-pgsql 參數
[root@DS-VM-Node160 /tmp/sysbench]# make -j `awk '/processor/{a++}END{print a}' /proc/cpuinfo` && make install
#0.5版本需要oltp.lua測試腳本
#如果是rpm包方式安裝的,在 /usr/share/doc/sysbench/tests/db/ 下可找到
[root@DS-VM-Node160 /tmp/sysbench]# cp -ai sysbench/tests /usr/local/sysbench/
[root@DS-VM-Node160 /tmp/sysbench]# echo 'export PATH=/usr/local/sysbench/bin:$PATH' >/etc/profile.d/sysbench.sh
[root@DS-VM-Node160 /tmp/sysbench]# . /etc/profile.d/sysbench.sh
[root@DS-VM-Node160 /tmp/sysbench]# which sysbench && cd
/usr/local/sysbench/bin/sysbench
[root@DS-VM-Node160 /tmp/sysbench]# sysbench --version
sysbench 0.5
sysbench 使用yum安裝
[root@DS-VM-Node160 /tmp]# yum install http://www.percona.com/downloads/percona-release/percona-release-0.0-1.x86_64.rpm -y
[root@DS-VM-Node160 /tmp/sysbench]# yum install sysbench -y
使用sysbench測試MySQL
##創建一個壓測使用的庫
[root@DS-VM-Node160 ~]# mysql -uroot -p******* -h10.10.231.149 -P3317 -e 'SELECT version();'
+-----------------------+
| version() |
+-----------------------+
| 10.0.25-MariaDB-wsrep |
+-----------------------+
[root@DS-VM-Node160 ~]# mysql -uroot -p****** -h10.10.231.149 -P3317 -e 'CREATE DATABASE sysbench;'
[root@DS-VM-Node160 ~]# mysql -uroot -p****** -h10.10.231.149 -P3317 -e "SHOW DATABASES LIKE '%sysbench%';"
+-----------------------+
| Database (%sysbench%) |
+-----------------------+
| sysbench |
+-----------------------+
[root@DS-VM-Node160 ~]#
###創建測試帳戶
[root@DS-VM-Node160 ~]# mysql -uroot -p****** -h10.10.231.149 -P3317 -e "GRANT ALL PRIVILEGES ON *.* TO 'sysbench'@'10.%.%.%' IDENTIFIED BY 'lookback';"
[root@DS-VM-Node160 ~]# mysql -uroot -p****** -h10.10.231.149 -P3317 -e "SELECT User,Password,Host FROM mysql.user WHERE User LIKE '%sysbench%';"
+----------+-------------------------------------------+----------+
| User | Password | Host |
+----------+-------------------------------------------+----------+
| sysbench | *153CCFAEAA83407D8DBDBFAA3D17B1A95553E60C | 10.%.%.% |
+----------+-------------------------------------------+----------+
[root@DS-VM-Node160 ~]#
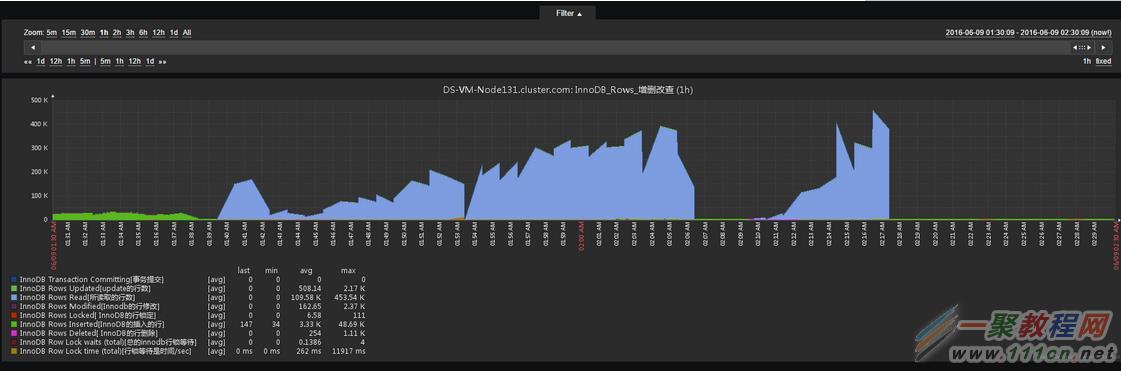
創建測試數據 表中有1kw條 估計大小有2GB
1
[root@DS-VM-Node160 ~]# sysbench --test=oltp --test=/usr/local/sysbench/tests/db/oltp.lua --db-driver=mysql --oltp-table-size=10000000 --mysql-db=sysbench --mysql-user=sysbench --mysql-password=lookback --mysql-host=10.10.231.149 --mysql-port=3317 prepare
###注意最後一個,一項測試開始前需要用prepare來准備好表和數據,run執行真正的壓測,cleanup用來清除數據和表。
sysbench 0.5: multi-threaded system evaluation benchmark
生成表的格式
[root@DS-VM-Node160 ~]# mysql -usysbench -plookback -h10.10.231.149 -P3317 -e "SELECT * FROM sysbench.sbtest1 ORDER BY id LIMIT 5;"
+----+---------+-------------------------------------------------------------------------------------------------------------------------+-------------------------------------------------------------+
| id | k | c | pad |
+----+---------+-------------------------------------------------------------------------------------------------------------------------+-------------------------------------------------------------+
| 2 | 3718516 | 08566691963-88624912351-16662227201-46648573979-64646226163-77505759394-75470094713-41097360717-15161106334-50535565977 | 63188288836-92351140030-06390587585-66802097351-49282961843 |
| 5 | 5934152 | 05879259692-02024081996-76022818191-82933803603-81845875017-31928300264-16934042125-67052432228-92123768050-95121478647 | 79362588344-09017007031-35411714211-52054317597-26283585383 |
| 8 | 3082941 | 16663631067-14838697989-64358398406-16917073223-47713406217-78812818873-46576803224-61955865221-97956448087-49259465660 | 52468633478-82076178857-68496668227-22002343387-57481185690 |
| 11 | 3371969 | 88814841367-98767826715-60494483894-21079440118-10718401291-33837777683-38627243809-45118876335-22718290515-23426562159 | 79384524915-41356971023-74955511882-92798558059-93482034638 |
| 14 | 4988307 | 87263726817-94340135738-17557808545-78801760644-04111877554-34439976372-12880746592-22897263227-59023974220-20489960934 | 34521232779-81152534024-26776427142-43102257779-39982840334 |
+----+---------+-------------------------------------------------------------------------------------------------------------------------+-------------------------------------------------------------+
[root@DS-VM-Node160 ~]#
Creating table 'sbtest1'...
Inserting 10000000 records into 'sbtest1'
開始做OLTP只讀測試 分別測試1 4 8 16 32 64線程
[root@DS-VM-Node160 ~]# for i in 1 4 8 16 32 64; do sysbench --test=oltp --test=/usr/local/sysbench/tests/db/oltp.lua --db-driver=mysql --oltp-table-size=10000000 --mysql-db=sysbench --mysql-user=sysbench --mysql-password=lookback --mysql-host=10.10.231.149 --mysql-port=3317 --max-time=60 --max-requests=0 --oltp-read-only --oltp-skip-trx --oltp-nontrx-mode=select --oltp-dist-type=uniform --oltp-test-mode=nontrx --report-interval=10 --num-threads=$i run; sleep 10; done
###參數解釋
--max-requests=0:壓力測試產生請求的總數,如果以下面的max-time來記,這個值設為0
#--max-time=60 壓測時間,此處設置為1分鐘
#--max-requests=0 limit for total number of requests [10000] "0 是無限制"
#--oltp-read-only=on:表示不產生只讀SQL,也就是使用oltp.lua時會采用只讀模式。默認 off,如果設置為on,則不會產生update,delete,insert的sql。
#--oltp-nontrx-mode=select 查詢類型對於非事務執行模式{select, update_key, update_nokey, insert, delete} [select]
#--num-threads 並發線程數,可以理解為模擬的客戶端並發連接數
#--oltp-tables-count=10 表數量
#--oltp-reconnect-mode=STRING 重新連接模式{session(不使用重新連接。每個線程斷開只在測試結束),transaction(在每次事務結束後重新連接),query(在每個SQL語句執行完重新連接),random(對於每個事務隨機選擇以上重新連接模式)}。默認是session
#--oltp-dist-type=uniform:指定隨機取樣類型,可選值有 uniform(均勻分布), Gaussian(高斯分布), special(空間分布)。默認是special
#--oltp-test-mode=nontrx:執行模式,這裡是非事務式的。可選值有simple,complex,nontrx。默認是complex
simple:簡單查詢,SELECT c FROM sbtest WHERE id=N
complex (advanced transactional):事務模式在開始和結束事務之前加上begin和commit, 一個事務裡可以有多個語句,如點查詢、范圍查詢、排序查詢、更新、刪除、插入等,並且為了不破壞測試表的數據,該模式下一條記錄刪除後會在同一個事務裡添加一條相同的記錄。
nontrx (non-transactional):與simple相似,但是可以進行update/insert等操作,所以如果做連續的對比壓測,你可能需要重新cleanup,prepare。
#--rand-init=on:是否隨機初始化數據,如果不隨機化那麼初始好的數據每行內容除了主鍵不同外其他完全相同
#--report-interval=10:表示每10s輸出一次測試進度報告
注意,針對不同的選項取值就會有不同的子選項。比如oltp-dist-type=special,就有比如oltp-dist-pct=1、oltp-dist-res=50兩個子選項,代表有50%的查詢落在1%的行(即熱點數據)上,另外50%均勻的(sample uniformly)落在另外99%的記錄行上。
再比如oltp-test-mode=nontrx時, 就可以有oltp-nontrx-mode,可選值有select(默認), update_key, update_nokey, insert, delete,代表非事務式模式下使用的測試sql類型。
以上代表的是一個只讀的例子,可以把num-threads依次遞增(16,36,72,128,256,512),或者調整my.cnf參數,比較效果。另外需要注意的是,大部分mysql中間件對事務的處理,默認都是把sql發到主庫執行,所以只讀測試需要加上oltp-skip-trx=on來跳過測試中的顯式事務。
ps1: 只讀測試也可以使用share/tests/db/select.lua進行,但只是簡單的point select。
ps2: 我在用sysbench壓的時候,在mysql後端會話裡有時看到大量的query cache lock,如果使用的是uniform取樣,最好把查詢緩存關掉。當然如果是做兩組性能對比壓測,因為都受這個因素影響,關心也不大。
下面是上面語句的測試結果
[root@DS-VM-Node160 ~]# for i in 1 4 8 16 32 64; do sysbench --test=oltp --test=/usr/local/sysbench/tests/db/oltp.lua --db-driver=mysql --oltp-table-size=10000000 --mysql-db=sysbench --mysql-user=sysbench --mysql-password=lookback --mysql-host=10.10.231.149 --mysql-port=3317 --max-time=60 --max-requests=0 --oltp-read-only --oltp-skip-trx --oltp-nontrx-mode=select --oltp-dist-type=uniform --oltp-test-mode=nontrx --report-interval=10 --num-threads=$i run; sleep 10; done
sysbench 0.5: multi-threaded system evaluation benchmark
Running the test with following options:
Number of threads: 1
Report intermediate results every 10 second(s)
Random number generator seed is 0 and will be ignored
Initializing worker threads...
Threads started!
[ 10s] threads: 1, tps: 86.10, reads: 1205.98, writes: 344.39, response time: 12.78ms (95%), errors: 0.00, reconnects: 0.00
[ 20s] threads: 1, tps: 80.30, reads: 1124.00, writes: 321.20, response time: 13.50ms (95%), errors: 0.00, reconnects: 0.00
[ 30s] threads: 1, tps: 80.20, reads: 1122.70, writes: 320.80, response time: 13.72ms (95%), errors: 0.00, reconnects: 0.00
[ 40s] threads: 1, tps: 80.30, reads: 1124.10, writes: 321.20, response time: 13.63ms (95%), errors: 0.00, reconnects: 0.00
[ 50s] threads: 1, tps: 79.70, reads: 1117.00, writes: 319.10, response time: 13.76ms (95%), errors: 0.00, reconnects: 0.00
[ 60s] threads: 1, tps: 78.00, reads: 1091.90, writes: 311.70, response time: 14.22ms (95%), errors: 0.00, reconnects: 0.00
OLTP test statistics:
queries performed:
read: 67858
write: 19388
other: 9694
total: 96940
transactions: 4847 (80.78 per sec.)
read/write requests: 87246 (1454.00 per sec.)
other operations: 9694 (161.56 per sec.)
ignored errors: 0 (0.00 per sec.)
reconnects: 0 (0.00 per sec.)
General statistics:
total time: 60.0040s
total number of events: 4847
total time taken by event execution: 59.9929s
response time:
min: 10.15ms
avg: 12.38ms
max: 112.96ms
approx. 95 percentile: 13.65ms
Threads fairness:
events (avg/stddev): 4847.0000/0.00
execution time (avg/stddev): 59.9929/0.00
sysbench 0.5: multi-threaded system evaluation benchmark
Running the test with following options:
Number of threads: 4
Report intermediate results every 10 second(s)
Random number generator seed is 0 and will be ignored
Initializing worker threads...
Threads started!
[ 10s] threads: 4, tps: 299.69, reads: 4199.52, writes: 1199.48, response time: 15.47ms (95%), errors: 0.00, reconnects: 0.00
[ 20s] threads: 4, tps: 299.70, reads: 4197.30, writes: 1198.90, response time: 14.89ms (95%), errors: 0.00, reconnects: 0.00
[ 30s] threads: 4, tps: 300.90, reads: 4207.30, writes: 1202.80, response time: 15.22ms (95%), errors: 0.00, reconnects: 0.00
[ 40s] threads: 4, tps: 295.20, reads: 4134.80, writes: 1180.90, response time: 15.72ms (95%), errors: 0.00, reconnects: 0.00
[ 50s] threads: 4, tps: 287.30, reads: 4025.80, writes: 1150.10, response time: 16.49ms (95%), errors: 0.00, reconnects: 0.00
[ 60s] threads: 4, tps: 298.90, reads: 4181.90, writes: 1194.60, response time: 16.48ms (95%), errors: 0.00, reconnects: 0.00
OLTP test statistics:
queries performed:
read: 249494
write: 71284
other: 35642
total: 356420
transactions: 17821 (296.96 per sec.)
read/write requests: 320778 (5345.30 per sec.)
other operations: 35642 (593.92 per sec.)
ignored errors: 0 (0.00 per sec.)
reconnects: 0 (0.00 per sec.)
General statistics:
total time: 60.0113s
total number of events: 17821
total time taken by event execution: 239.9966s
response time:
min: 10.87ms
avg: 13.47ms
max: 122.42ms
approx. 95 percentile: 15.66ms
Threads fairness:
events (avg/stddev): 4455.2500/9.44
execution time (avg/stddev): 59.9992/0.00
sysbench 0.5: multi-threaded system evaluation benchmark
Running the test with following options:
Number of threads: 8
Report intermediate results every 10 second(s)
Random number generator seed is 0 and will be ignored
Initializing worker threads...
Threads started!
[ 10s] threads: 8, tps: 485.19, reads: 6799.80, writes: 1941.77, response time: 22.12ms (95%), errors: 0.00, reconnects: 0.00
[ 20s] threads: 8, tps: 481.50, reads: 6744.80, writes: 1926.80, response time: 23.56ms (95%), errors: 0.00, reconnects: 0.00
[ 30s] threads: 8, tps: 480.10, reads: 6715.70, writes: 1918.80, response time: 24.27ms (95%), errors: 0.00, reconnects: 0.00
[ 40s] threads: 8, tps: 452.50, reads: 6340.60, writes: 1811.60, response time: 24.72ms (95%), errors: 0.00, reconnects: 0.00
[ 50s] threads: 8, tps: 480.40, reads: 6722.80, writes: 1921.40, response time: 24.54ms (95%), errors: 0.00, reconnects: 0.00
[ 60s] threads: 8, tps: 485.20, reads: 6796.00, writes: 1942.00, response time: 24.75ms (95%), errors: 0.00, reconnects: 0.00
OLTP test statistics:
queries performed:
read: 401198
write: 114628
other: 57314
total: 573140
transactions: 28657 (477.27 per sec.)
read/write requests: 515826 (8590.92 per sec.)
other operations: 57314 (954.55 per sec.)
ignored errors: 0 (0.00 per sec.)
reconnects: 0 (0.00 per sec.)
General statistics:
total time: 60.0432s
total number of events: 28657
total time taken by event execution: 480.2772s
response time:
min: 11.03ms
avg: 16.76ms
max: 294.31ms
approx. 95 percentile: 24.07ms
Threads fairness:
events (avg/stddev): 3582.1250/9.12
execution time (avg/stddev): 60.0346/0.00
sysbench 0.5: multi-threaded system evaluation benchmark
Running the test with following options:
Number of threads: 16
Report intermediate results every 10 second(s)
Random number generator seed is 0 and will be ignored
Initializing worker threads...
Threads started!
[ 10s] threads: 16, tps: 755.09, reads: 10587.34, writes: 3021.85, response time: 30.39ms (95%), errors: 0.00, reconnects: 0.00
[ 20s] threads: 16, tps: 753.80, reads: 10553.58, writes: 3014.79, response time: 30.25ms (95%), errors: 0.00, reconnects: 0.00
[ 30s] threads: 16, tps: 694.90, reads: 9728.53, writes: 2778.51, response time: 35.96ms (95%), errors: 0.00, reconnects: 0.00
[ 40s] threads: 16, tps: 571.10, reads: 8001.37, writes: 2290.79, response time: 33.51ms (95%), errors: 0.00, reconnects: 0.00
[ 50s] threads: 16, tps: 563.60, reads: 7883.93, writes: 2249.71, response time: 32.86ms (95%), errors: 0.00, reconnects: 0.00
[ 60s] threads: 16, tps: 756.50, reads: 10586.50, writes: 3025.50, response time: 30.67ms (95%), errors: 0.00, reconnects: 0.00
OLTP test statistics:
queries performed:
read: 573524
write: 163864
other: 81932
total: 819320
transactions: 40966 (682.58 per sec.)
read/write requests: 737388 (12286.43 per sec.)
other operations: 81932 (1365.16 per sec.)
ignored errors: 0 (0.00 per sec.)
reconnects: 0 (0.00 per sec.)
General statistics:
total time: 60.0165s
total number of events: 40966
total time taken by event execution: 960.0691s
response time:
min: 12.99ms
avg: 23.44ms
max: 2295.61ms
approx. 95 percentile: 32.15ms
Threads fairness:
events (avg/stddev): 2560.3750/33.23
execution time (avg/stddev): 60.0043/0.01
sysbench 0.5: multi-threaded system evaluation benchmark
Running the test with following options:
Number of threads: 32
Report intermediate results every 10 second(s)
Random number generator seed is 0 and will be ignored
Initializing worker threads...
Threads started!
[ 10s] threads: 32, tps: 891.19, reads: 12504.40, writes: 3568.44, response time: 54.01ms (95%), errors: 0.00, reconnects: 0.00
[ 20s] threads: 32, tps: 998.60, reads: 13975.92, writes: 3992.61, response time: 51.92ms (95%), errors: 0.00, reconnects: 0.00
[ 30s] threads: 32, tps: 962.60, reads: 13476.78, writes: 3849.79, response time: 48.25ms (95%), errors: 0.00, reconnects: 0.00
[ 40s] threads: 32, tps: 1046.50, reads: 14653.70, writes: 4187.60, response time: 46.25ms (95%), errors: 0.00, reconnects: 0.00
[ 50s] threads: 32, tps: 1009.70, reads: 14140.21, writes: 4036.90, response time: 47.09ms (95%), errors: 0.00, reconnects: 0.00
[ 60s] threads: 32, tps: 966.20, reads: 13520.91, writes: 3865.00, response time: 49.98ms (95%), errors: 0.00, reconnects: 0.00
OLTP test statistics:
queries performed:
read: 822920
write: 235120
other: 117560
total: 1175600
transactions: 58780 (978.89 per sec.)
read/write requests: 1058040 (17620.08 per sec.)
other operations: 117560 (1957.79 per sec.)
ignored errors: 0 (0.00 per sec.)
reconnects: 0 (0.00 per sec.)
General statistics:
total time: 60.0474s
total number of events: 58780
total time taken by event execution: 1920.5471s
response time:
min: 14.57ms
avg: 32.67ms
max: 732.59ms
approx. 95 percentile: 49.49ms
Threads fairness:
events (avg/stddev): 1836.8750/27.39
execution time (avg/stddev): 60.0171/0.01
sysbench 0.5: multi-threaded system evaluation benchmark
Running the test with following options:
Number of threads: 64
Report intermediate results every 10 second(s)
Random number generator seed is 0 and will be ignored
Initializing worker threads...
Threads started!
[ 10s] threads: 64, tps: 1094.98, reads: 15400.07, writes: 4391.91, response time: 101.24ms (95%), errors: 0.00, reconnects: 0.00
[ 20s] threads: 64, tps: 1052.40, reads: 14737.81, writes: 4204.60, response time: 106.62ms (95%), errors: 0.00, reconnects: 0.00
[ 30s] threads: 64, tps: 1129.60, reads: 15817.40, writes: 4522.60, response time: 98.67ms (95%), errors: 0.00, reconnects: 0.00
[ 40s] threads: 64, tps: 956.60, reads: 13404.34, writes: 3840.78, response time: 111.78ms (95%), errors: 0.00, reconnects: 0.00
[ 50s] threads: 64, tps: 1088.30, reads: 15224.31, writes: 4339.80, response time: 102.06ms (95%), errors: 0.00, reconnects: 0.00
[ 60s] threads: 64, tps: 1135.50, reads: 15880.44, writes: 4535.51, response time: 101.39ms (95%), errors: 0.00, reconnects: 0.00
OLTP test statistics:
queries performed:
read: 904932
write: 258552
other: 129276
total: 1292760
transactions: 64638 (1076.69 per sec.)
read/write requests: 1163484 (19380.45 per sec.)
other operations: 129276 (2153.38 per sec.)
ignored errors: 0 (0.00 per sec.)
reconnects: 0 (0.00 per sec.)
General statistics:
total time: 60.0339s
total number of events: 64638
total time taken by event execution: 3841.3044s
response time:
min: 16.69ms
avg: 59.43ms
max: 1045.31ms
approx. 95 percentile: 103.48ms
Threads fairness:
events (avg/stddev): 1009.9688/19.97
execution time (avg/stddev): 60.0204/0.01
[root@DS-VM-Node160 ~]#
我們一般關注的用於繪圖的指標主要有:
response time avg: 平均響應時間。(後面的95%的大小可以通過--percentile=98的方式去更改)
transactions: 精確的說是這一項後面的TPS 。但如果使用了-oltp-skip-trx=on,這項事務數恆為0,需要用total number of events 去除以總時間,得到tps(其實還可以分為讀tps和寫tps)
read/write requests: 用它除以總時間,得到吞吐量QPS
當然還有一些系統層面的cpu,io,mem相關指標
mysql教程排行
程序編程推薦
相關文章
- mysql主從配置之slave_exec_mode=IDEMPOTENT詳解
- sysbench壓測之MySQL壓測的例子
- mysql優化之status和variables對比
- Mysql壓測工具mysqlslap工具使用方法詳解
- mysql優化之show status查看MySQL服務器狀態信息
- MySQL 數據庫性能優化之SQL語句及查詢優化
- php 給cookie賦值之setcookie()用法
- php中查找字符呂函數之strstr,strpos,substr,strrchr…
- SqlServer應用之sys.dm
- HTML5學習筆記簡明版(2):新元素之section,article,asid…
- Java條件語句之 switch(新手教程)


