萬盛學電腦網 >> 網絡編程 >> 編程語言綜合 >> Python使用matplotlib實現在坐標系中畫一個矩形的方法
Python使用matplotlib實現在坐標系中畫一個矩形的方法
本文實例講述了Python使用matplotlib實現在坐標系中畫一個矩形的方法。分享給大家供大家參考。具體實現方法如下:
?
1 2 3 4 5 6 7 8 9 10 11 12 13 14 15 16 17 18 19 20 21 22 23 24 25 26 27 import matplotlib.pyplot as plt from matplotlib.patches import Rectangle class Annotate(object): def __init__(self): self.ax = plt.gca() self.rect = Rectangle((0,0), 1, 1) self.x0 = None self.y0 = None self.x1 = None self.y1 = None self.ax.add_patch(self.rect) self.ax.figure.canvas.mpl_connect('button_press_event', self.on_press) self.ax.figure.canvas.mpl_connect('button_release_event', self.on_release) def on_press(self, event): print 'press' self.x0 = event.xdata self.y0 = event.ydata def on_release(self, event): print 'release' self.x1 = event.xdata self.y1 = event.ydata self.rect.set_width(self.x1 - self.x0) self.rect.set_height(self.y1 - self.y0) self.rect.set_xy((self.x0, self.y0)) self.ax.figure.canvas.draw() a = Annotate() plt.show()如下圖所示:
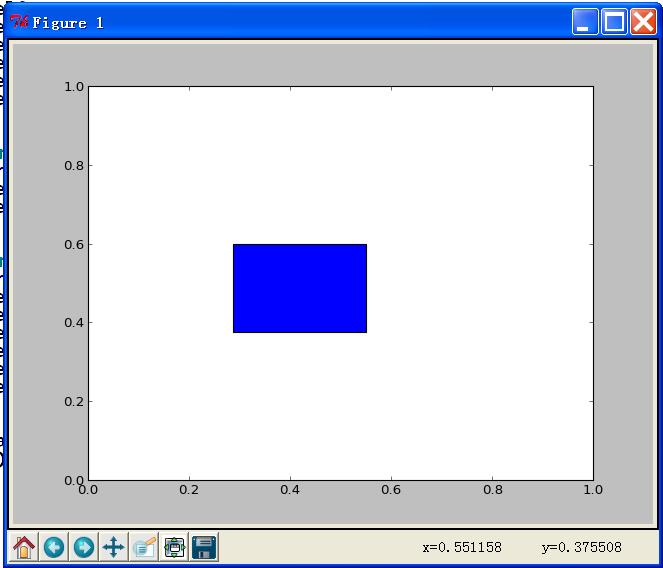
希望本文所述對大家的Python程序設計有所幫助。
編程語言綜合排行
程序編程推薦
相關文章
- CSSclippath使用技巧
- clearboth的作用介紹
- SQL Server 2012 身份驗證(Authentication)
- 在Linux系統下使用Github的基本教程
- 在Linux系統上怎麼通過uWSGI配置Nginx+Python環境
- Linux系統上Nginx+Python的web.py與Django框架環境
- Linux下將Python的Django項目部署到Apache服務器
- 在Linux系統上部署Apache+Python+Django+MySQL環境
- divcssclearboth的作用介紹
- cssminwidth最小寬度的作用介紹
- 使用 iOS 7 的 AVSpeechSynthesizer 制作有聲書的方法


copyright © 萬盛學電腦網 all rights reserved